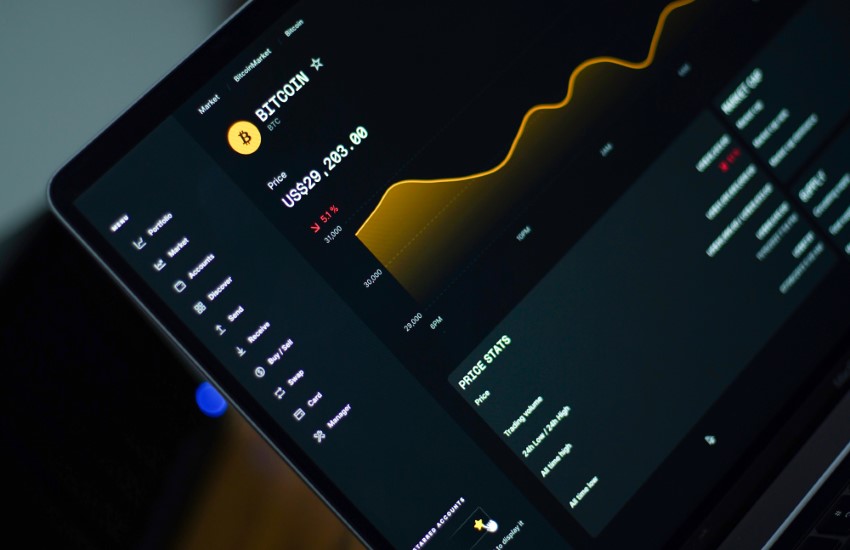
To interpret crypto trading data, you will need to understand the different types of indicators and metrics that are used in it. The most common metrics used for assessing cryptocurrencies include price, market capitalization, volume, volatility, and liquidity. This article will discuss each of these metrics, and explain how they can be used to help you interpret trading data.
Most Important Datasets For Trading Crypto
As a beginner, it can feel overwhelming to see the sheer amount of data available in crypto trading. Before we discuss the top 5 datasets used for trading crypto, let’s consider which tool is the most appropriate for tracking this information.
Moonrig.io serves as the leading crypto portfolio management software. It enables users to monitor crypto in real-time and it sends instant crypto notifications. So, not only will you have access to the essential data points required to interpret crypto trading data, but you will also be able to track price movements and pertinent news feeds.
Price: The price of a cryptocurrency is simply the amount being asked for it in a given market. It is usually shown as the last traded price or the closing price on a specific exchange. This metric can be used to gauge the current interest in an asset and also provides insight into its current value relative to other currencies.
Market Capitalization: Market capitalization is calculated by taking the total number of coins in circulation multiplied by their current prices. It reflects how much of an asset’s value is held by investors, rather than traders and speculators. Market capitalization provides valuable insight into investor confidence in a particular asset.
Volume: The volume of a cryptocurrency trading pair is the number of trades that occur within a given period of time. This metric can be used to assess how popular and active an asset is, as well as to identify potential buying and selling opportunities.
Volatility: Volatility measures the degree to which an asset’s price fluctuates over time. High volatility indicates that the asset’s price is likely to move up or down quickly, making it potentially risky for investors. Low volatility suggests that prices are more stable and less prone to large swings in value.
Liquidity: Liquidity is an important measure of how easily you can buy and sell an asset at any given point in time. A highly liquid market has plenty of buyers and sellers, making it easier to enter or exit a position without incurring significant losses. On the other hand, a low liquidity market may be difficult to trade in as there are not enough buyers and sellers available.
Final Thoughts
By understanding these metrics, you can gain a better appreciation for the current state of the crypto markets and how they affect your trading decisions. With this knowledge, you will be able to interpret crypto trading data more effectively and make smarter investment decisions. Try Moonrig.io to make the most out of this data!


