Technical analysis in trading is a method of trying to predict future price movements of a financial instrument (like a stock, currency, or commodity) by studying past market data, primarily price and volume. Here’s a breakdown of the key aspects:
Core Principles:
- History tends to repeat itself: Technical analysts believe that market patterns and trends tend to repeat over time. By identifying these patterns, they try to anticipate future price movements.
- Price discounts everything: This means that all known information about a particular asset is already reflected in its price. Therefore, studying the price action itself is sufficient for making trading decisions.
- Trends exist in markets: The idea is that prices tend to move in trends, and technical analysis helps identify these trends and trade in their direction.
Tools and Techniques:
Technical analysts use various tools and techniques to analyze charts and identify patterns:
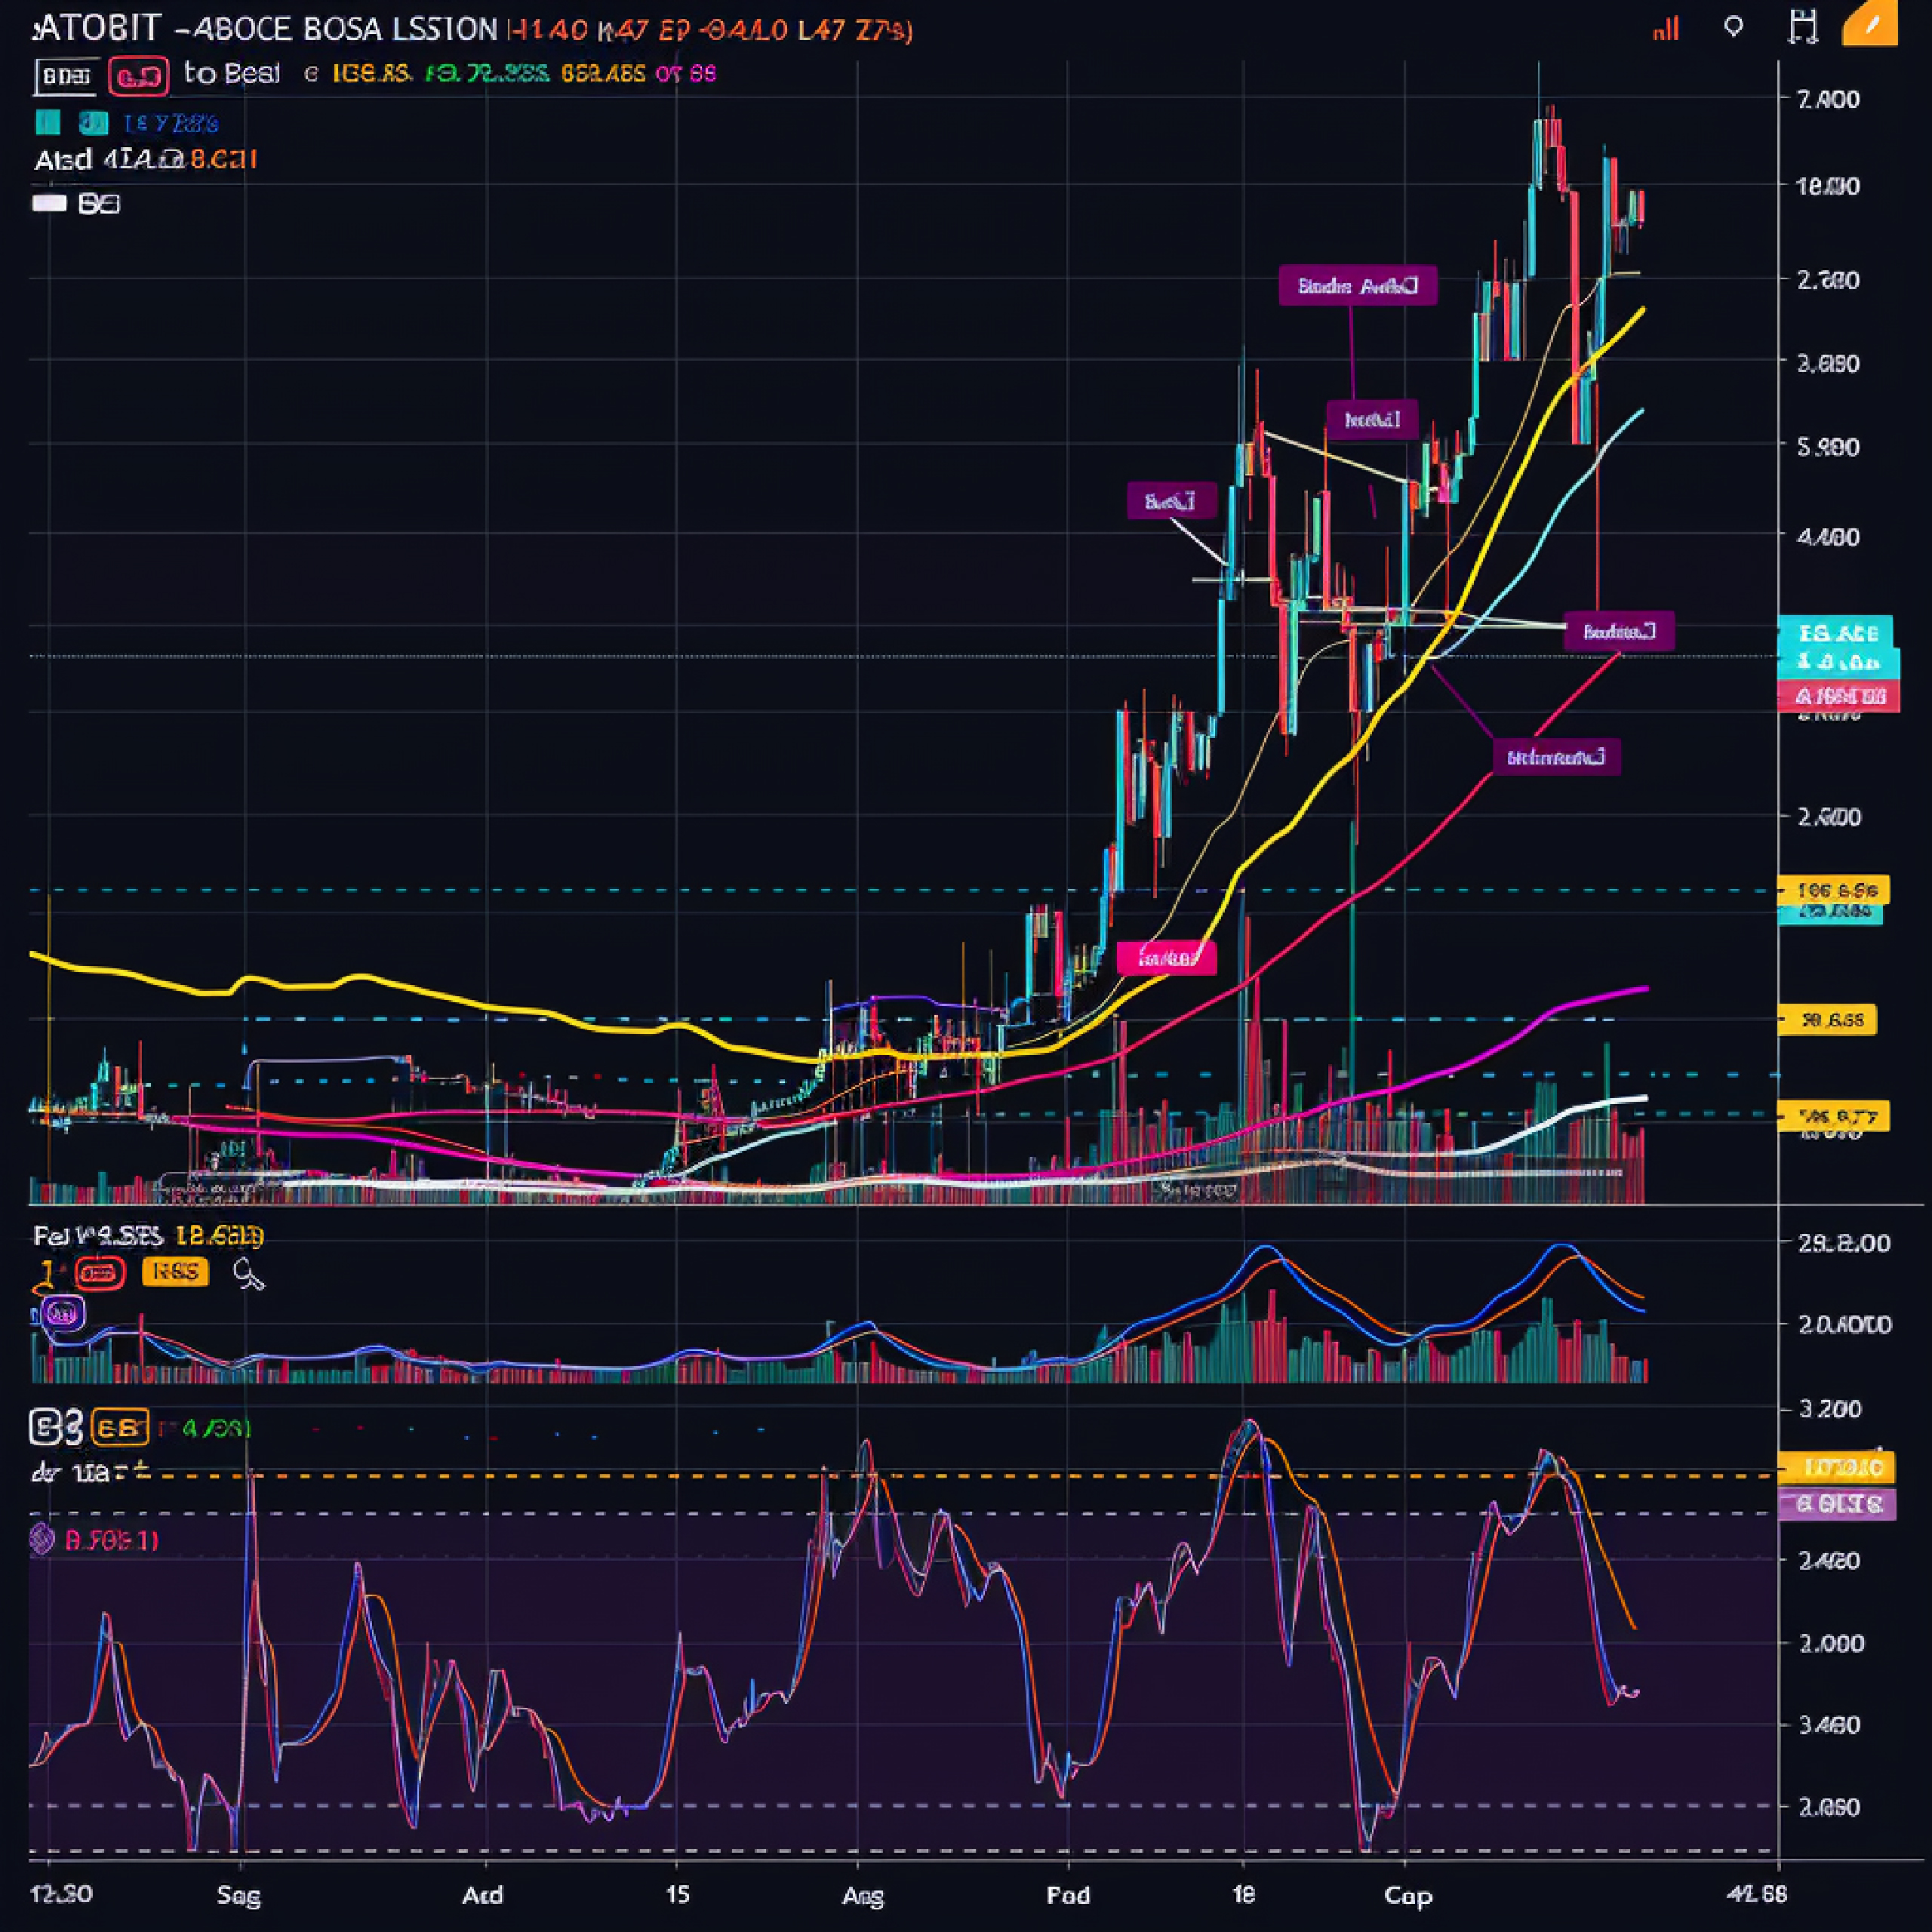
- Charts: These are visual representations of price movements over time. Common chart types include line charts, bar charts, and candlestick charts.
- Trendlines: These are lines drawn on charts to connect a series of highs or lows, helping to identify the direction of a trend.
- Support and Resistance Levels: These are price levels where the price has historically tended to find support (a floor) or resistance (a ceiling).
- Moving Averages: These are lines that smooth out price data by averaging it over a specific period, helping to identify trends and potential buy or sell signals.
- Technical Indicators: These are mathematical calculations based on price and/or volume data that are used to generate trading signals. Examples include the Relative Strength Index (RSI), Moving Average Convergence Divergence (MACD), and Bollinger Bands.
- Chart Patterns: These are recognizable patterns that appear on charts and are believed to have predictive value. Examples include head and shoulders, double tops and bottoms, and triangles.
Differences from Fundamental Analysis:
Technical analysis differs from fundamental analysis, which focuses on evaluating the intrinsic value of an asset by analyzing factors such as:
- Financial statements
- Management
- Industry trends
- Economic conditions
Strengths of Technical Analysis:
- Can be applied to any market with historical price data.
- Helps to identify entry and exit points for trades.
- Can be used in conjunction with other forms of analysis.
Limitations of Technical Analysis:
- Not always accurate, as markets can be unpredictable.
- Can be subjective, as different analysts may interpret the same data differently.
- Can lead to self-fulfilling prophecies, as traders acting on the same signals can influence price movements.
In Conclusion:
Technical analysis is a valuable tool for traders, but it’s essential to understand its limitations and use it in conjunction with other forms of analysis and risk management techniques.
Get in touch with us to find out more
Our Official Social Media Channels
LinkedIn
Twitter / X
Instagram
Telegram
Facebook
YouTube
TikTok